What Resource Allocation Shows
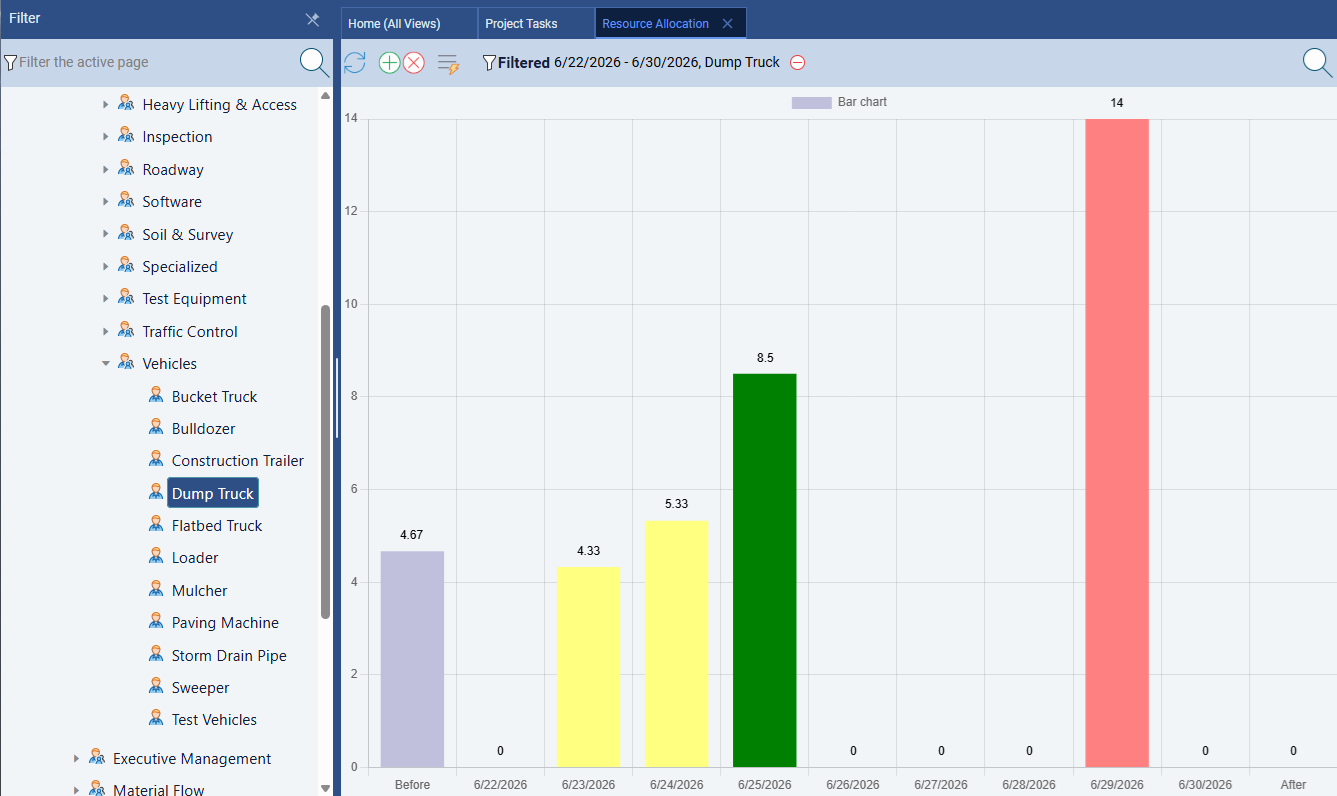
Resource Allocation is a bar and grid chart, built into Standard Time®'s project management tools, that plots every employee's assigned workload against their available capacity across a timeline. Instead of digging through the Gantt chart task by task, you get one view that answers a single question at a glance: who has room for more work, and who is already overloaded?
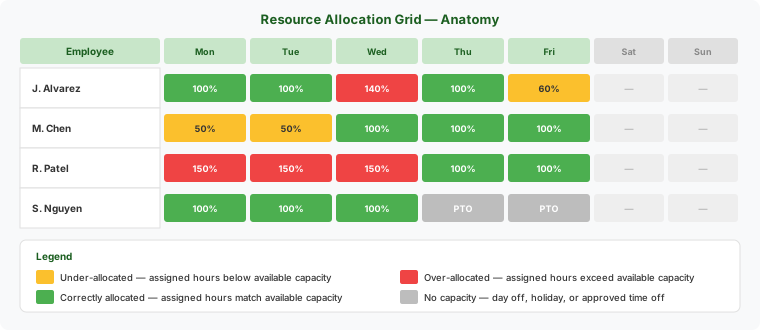
Each cell in the chart represents one person, on one day (or week, month, or year), color-coded by how their assigned hours compare to the hours they actually have available.
How Assignment Percentages Drive the Chart
The numbers behind Resource Allocation come directly from Project Tasks. Every task can be assigned to one or more users (or workgroups), and each assigned user carries an assignment percentage — how much of that person's time the task is expected to consume while it's active.
- A task assigned to one person at 100% expects their full time for its duration.
- A task assigned to one person at 50% expects half their time — leaving the other half free for another task.
- A person can be assigned to multiple overlapping tasks at once, each with its own percentage. Standard Time® sums every assignment that overlaps a given day to compute that person's total assigned load.
Because assignment percentage is set per task, per person, Resource Allocation reflects real overlapping workload — not just a simple headcount of who's on a project.
AssignPerc field on ProjectTasks, alongside UserIDs and GroupIDs. It's the same field Standard Time®'s AI scheduling uses when it levels resources automatically — see AI Scheduling.
Reading the Color-Coded Bars
Every cell on the Resource Allocation chart is colored according to how assigned hours compare to available capacity for that person and period:
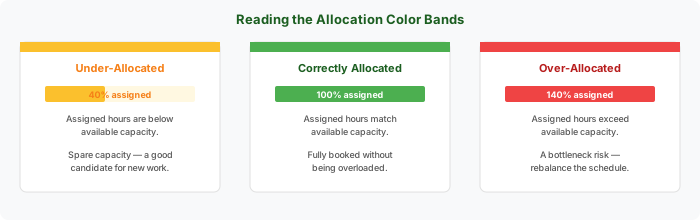
Green cells mean the schedule is working as planned. Yellow cells flag people you can safely assign more work to without risking a delay elsewhere. Red cells are the ones worth investigating first — they mean the current schedule is asking someone for more hours than they actually have.
Where Available Capacity Comes From
Available capacity isn't just a flat number of hours in a workday — Standard Time® nets it down from each person's calendar automatically:
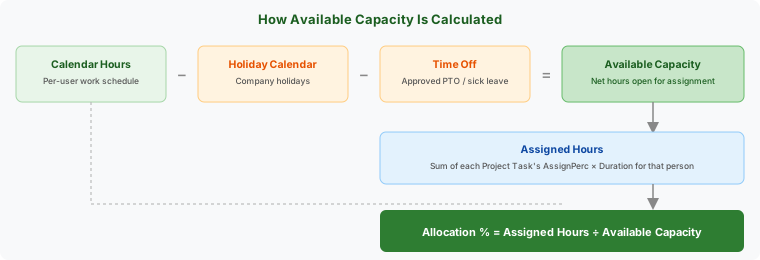
- Calendar hours — each user's normal working schedule.
- Holiday Calendar — company holidays automatically remove capacity on the days they fall, so allocation math never expects work on a day the whole shop is closed.
- Time Off & Leave Management — approved PTO, vacation, and sick leave subtract capacity for the specific person and dates approved, without anyone having to manually zero out their allocation.
What's left after those deductions is available capacity — the number every assigned-hour total is measured against to produce the allocation percentage and color on the chart.
Switching Between Day, Week, Month, and Year
Resource Allocation supports four rollup levels, so you can zoom out for a big-picture capacity check or zoom in to see exactly which day a conflict happens:
- Day — the finest detail; best for confirming a specific scheduling conflict before you move a task.
- Week — a full workweek per person; the most common view for day-to-day production planning.
- Month — useful for spotting a person who is trending over capacity across an entire job cycle.
- Year — a long-range capacity check, useful when planning hiring or scheduling a large multi-month program.
Switching rollup levels doesn't change the underlying data — it just changes how many days of assigned and available hours are summed into each cell before the color is calculated.
Rebalancing an Over-Allocated Schedule
Once you've spotted a red, over-allocated cell, there are three ways to fix it:
- Reassign the task — open the task's Properties panel and add or swap a user, splitting the assignment percentage between people so no one exceeds their available capacity.
- Reschedule on the Gantt chart — drag the conflicting task bar to a day where the assigned person still has spare (yellow) capacity. See dragging bars to reschedule.
- Let AI resource-level the schedule — ask AI Chat to resolve the conflict in plain language (for example, "rebalance this week so no one is over-allocated") and Standard Time®'s AI scheduling engine proposes a reschedule for your approval. See AI Scheduling.
How to Open Resource Allocation
- From the Home screen, click Resource Allocation in the navigation tabs.
- Use the Filter panel to narrow the chart to a specific project, folder, or set of users.
- Choose your rollup level — Day, Week, Month, or Year — from the view controls at the top of the chart.
- Scan for red (over-allocated) cells first, then check yellow (under-allocated) cells for people who can absorb new work.
Resource Allocation is part of Standard Time®'s Project Management tools, included on Pro and Enterprise plans. See the full feature list on the Features page.